


Description
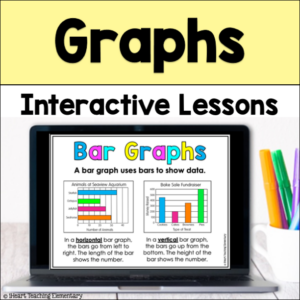
Need help teaching students bar graphs, picture graphs, and line plots? These digital interactive anchor chart slides will help your students learn or practice these 3 types of graphs in a digital format.
They can be used whole group or for individual students that are struggling or were absent when you taught the lesson.
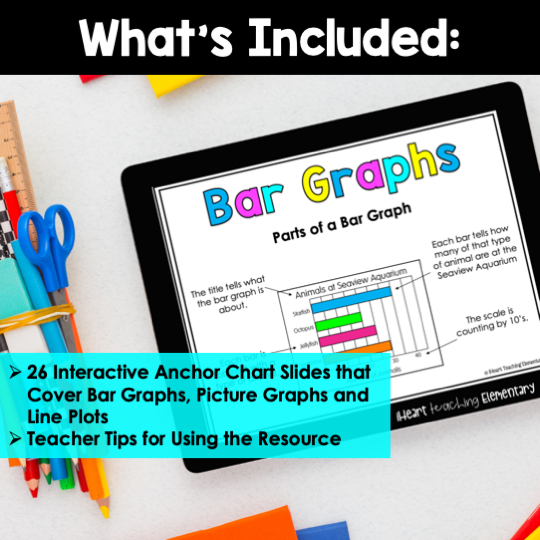
There are 26 anchor chart slides that go over bar graphs, picture graphs, and line plots. A frequency table chart is also included.
Click HERE to save $ on the 3rd Grade Math Interactive Slides Bundle.
This resource includes:
- 26 Interactive Graph Anchor Chart Slides so your students can interact and learn about bar graphs, picture graphs, and line plots.
- “Your Turn Slides” are sprinkled throughout so your students can interact with the anchor chart to practice the skill.
- Teacher Tips Sheet so you can try what has worked when using this resource.
- Student Sharing Directions Guide so you can see step-by-step how to assign this in Google Classroom.
*These are Google Slides and students must have a Gmail account to be able to use them.
*** Check out the preview to take a closer look.***
Listen to what teachers are saying about some of the 3rd-grade math interactive anchor charts:
⭐️⭐️⭐️⭐️⭐️ Lisa- This is a fantastic resource and was great for distance learning.
⭐️⭐️⭐️⭐️⭐️⭐️ Sarah- This resource was perfect for distance learning! I used them during our Google Meets.
⭐️⭐️⭐️⭐️⭐️⭐️ Stephanie- Love the anchor charts and the examples. This has really helped my students with their rounding during distance learning.
Copyright © iHeart Teaching Elementary
Permission to copy for single classroom use only.
Please purchase additional licenses if you intend to share this product.
Reviews
There are no reviews yet.